
Design Awareness
HCDE Independent Research, In Progress
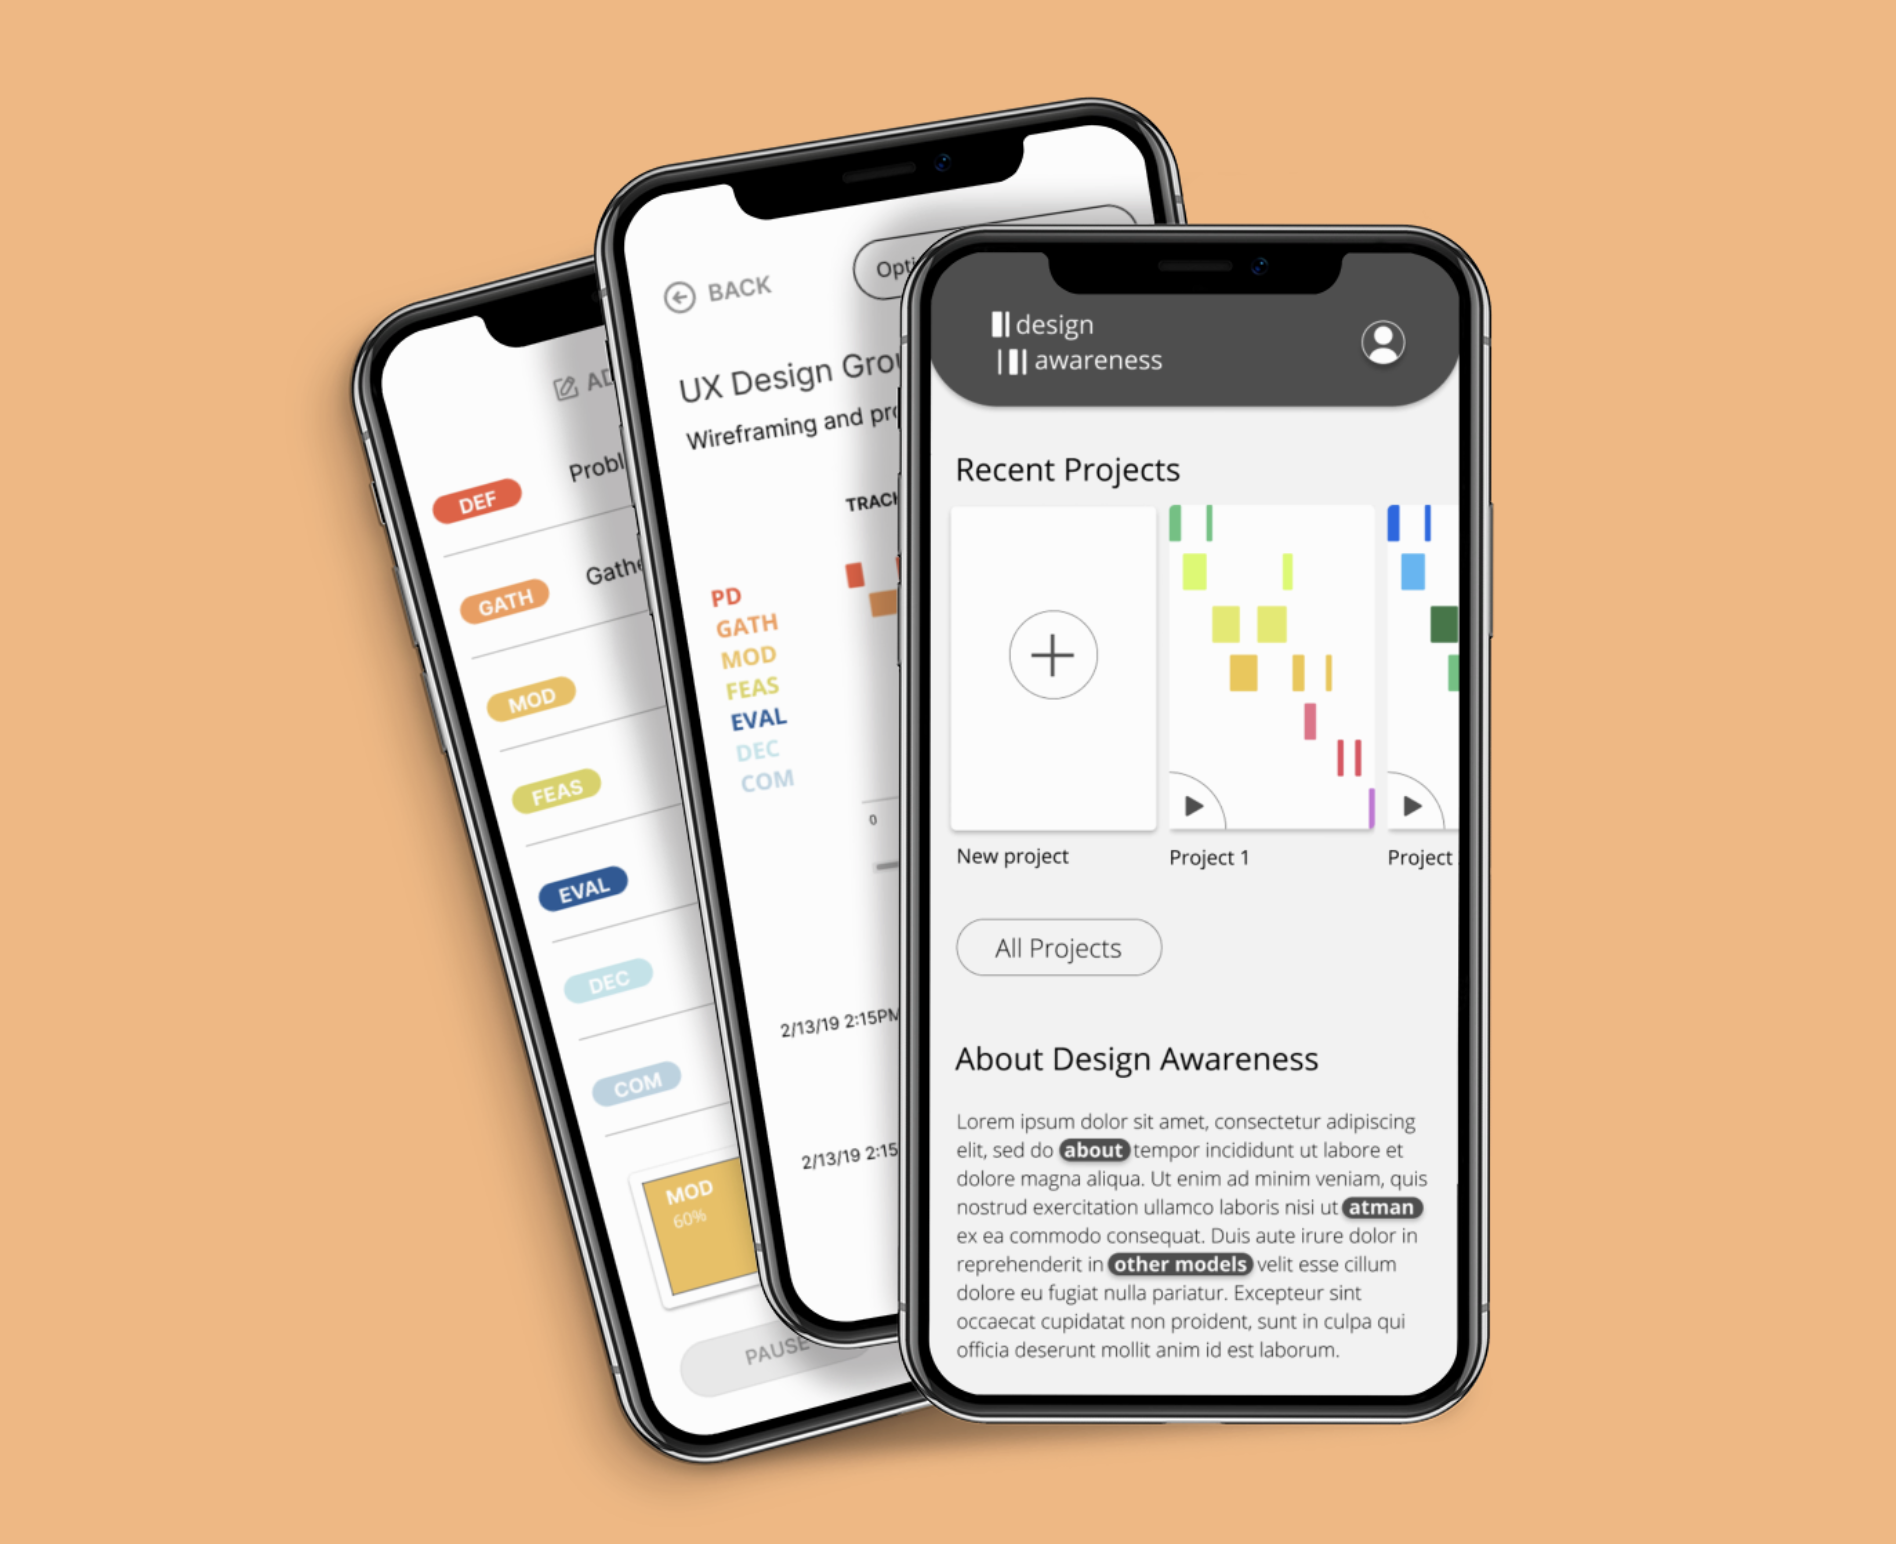
Over the past year I have worked with a small team to research, design, and develop a “design awareness tool”. Our goal was to help others become more aware of their individual design processes. Throughout the process we hoped that people would be able to make more informed design decisions potentially leading to more effective designs, products, and solutions through the use of our app.
Our Team
Undergraduate Students
Grace Barar, Rylie Sweem, Shiva Rithwick Anem, Jordan-Yoon Buck
Professor
Cynthia J. Atman
My Role
I co-led the research and design awareness investigation at the outset of our design process. I then headed the visual design for the interface and app, and created a visual style guide.
Our Design Process
01
Defining the problem
02
Understanding the user
03
Framing the solution
04
Designing the solution
Defining the problem
02
Understanding the user
03
Framing the solution
04
Designing the solution
05
Refining the solution
06
Iterating the solution
07
Finalizing the solution (Coming soon!)
Refining the solution
06
Iterating the solution
07
Finalizing the solution (Coming soon!)
01 Defining the Problem
The ProblemFor designers and anyone engaged in creative work, it is the individual design process the determines the quality of the work produced and designs created. Regardless of the importance of the design process, there are not many accessible or widely used tools and methods to assist designers in identifying, understanding, assessing, and potentially altering their own design process for self-improvement.
The Background Atman’s research as well as research conducted within our team suggests that the quality of people’s designs are correlated to their individual design process. During a study conducted by Cynthia Atman, participants were tasked with the designing an imaginary playground and park facility. Participants were observed and their design behaviors were recorded. Codes were then assigned to each design behavior/step of design process. Codes were then translated into coded bubble sheets organized in time intervals (figure 1).

Figure 1. Bubble sheet used to capture design process
Atman coined the name “design timelines” for the coded bubble sheets. The design timelines were then organized and assessed based on the quality of the design work produced. Findings show that the individuals with more expertise and higher quality designs had more complex processes, consider a broader set of information, and spent more time problem solving. In addition to this individuals with more expertise and high quality designs were also more likely to demonstrate a cascade patten (figure 2) in their design activities [1].

Figure 2. Design timeline demonstrating high level of expertise and quality design
Our Challenge Design and develop a tool to help creatives become aware of their own design processes with a goal of modifying their process to eventually emulate the ideal design timeline.
[1] Atman, C.J., Adams, R.S., Cardella, M.E., Turns, J., Mosborg, S. and Saleem, J. (2007), Engineering Design Processes: A Comparison of Students and Expert Practitioners. Journal of Engineering Education, 96: 359-379. doi:10.1002/j.2168-9830.2007.tb00945.x
02 Understanding the User
Target Users
Expert and Amateur designers
Once again, our tool would help creatives become aware of their own design processes with a goal of modifying their process to eventually emulate the ideal design timeline.

We created this persona based on autobiographical exploratory research and interviews with 3 different designers with different expertise
03 Framing the Solution
Design Requirements
We wanted to ensure that every design decision we made about our product was rooted in a real-world user need.
What they said
"I often take breaks and spread my design work over a period of time"
"I found it hard to remind myself to fill in the bubbles in timely intervals"
"It's very hard to interpret what's happening at a given point of time on my design timeline"
"I found it hard to remind myself to fill in the bubbles in timely intervals"
"It's very hard to interpret what's happening at a given point of time on my design timeline"
What we did
Include a pause feature while users are tracking. Allow users to resume projects.
Remind users in timely intervals to input design activities they are engaging in.
Add colors to represent each design activity code to reduce the cognitive load on users
Include a pause feature while users are tracking. Allow users to resume projects.
Remind users in timely intervals to input design activities they are engaging in.
Add colors to represent each design activity code to reduce the cognitive load on users
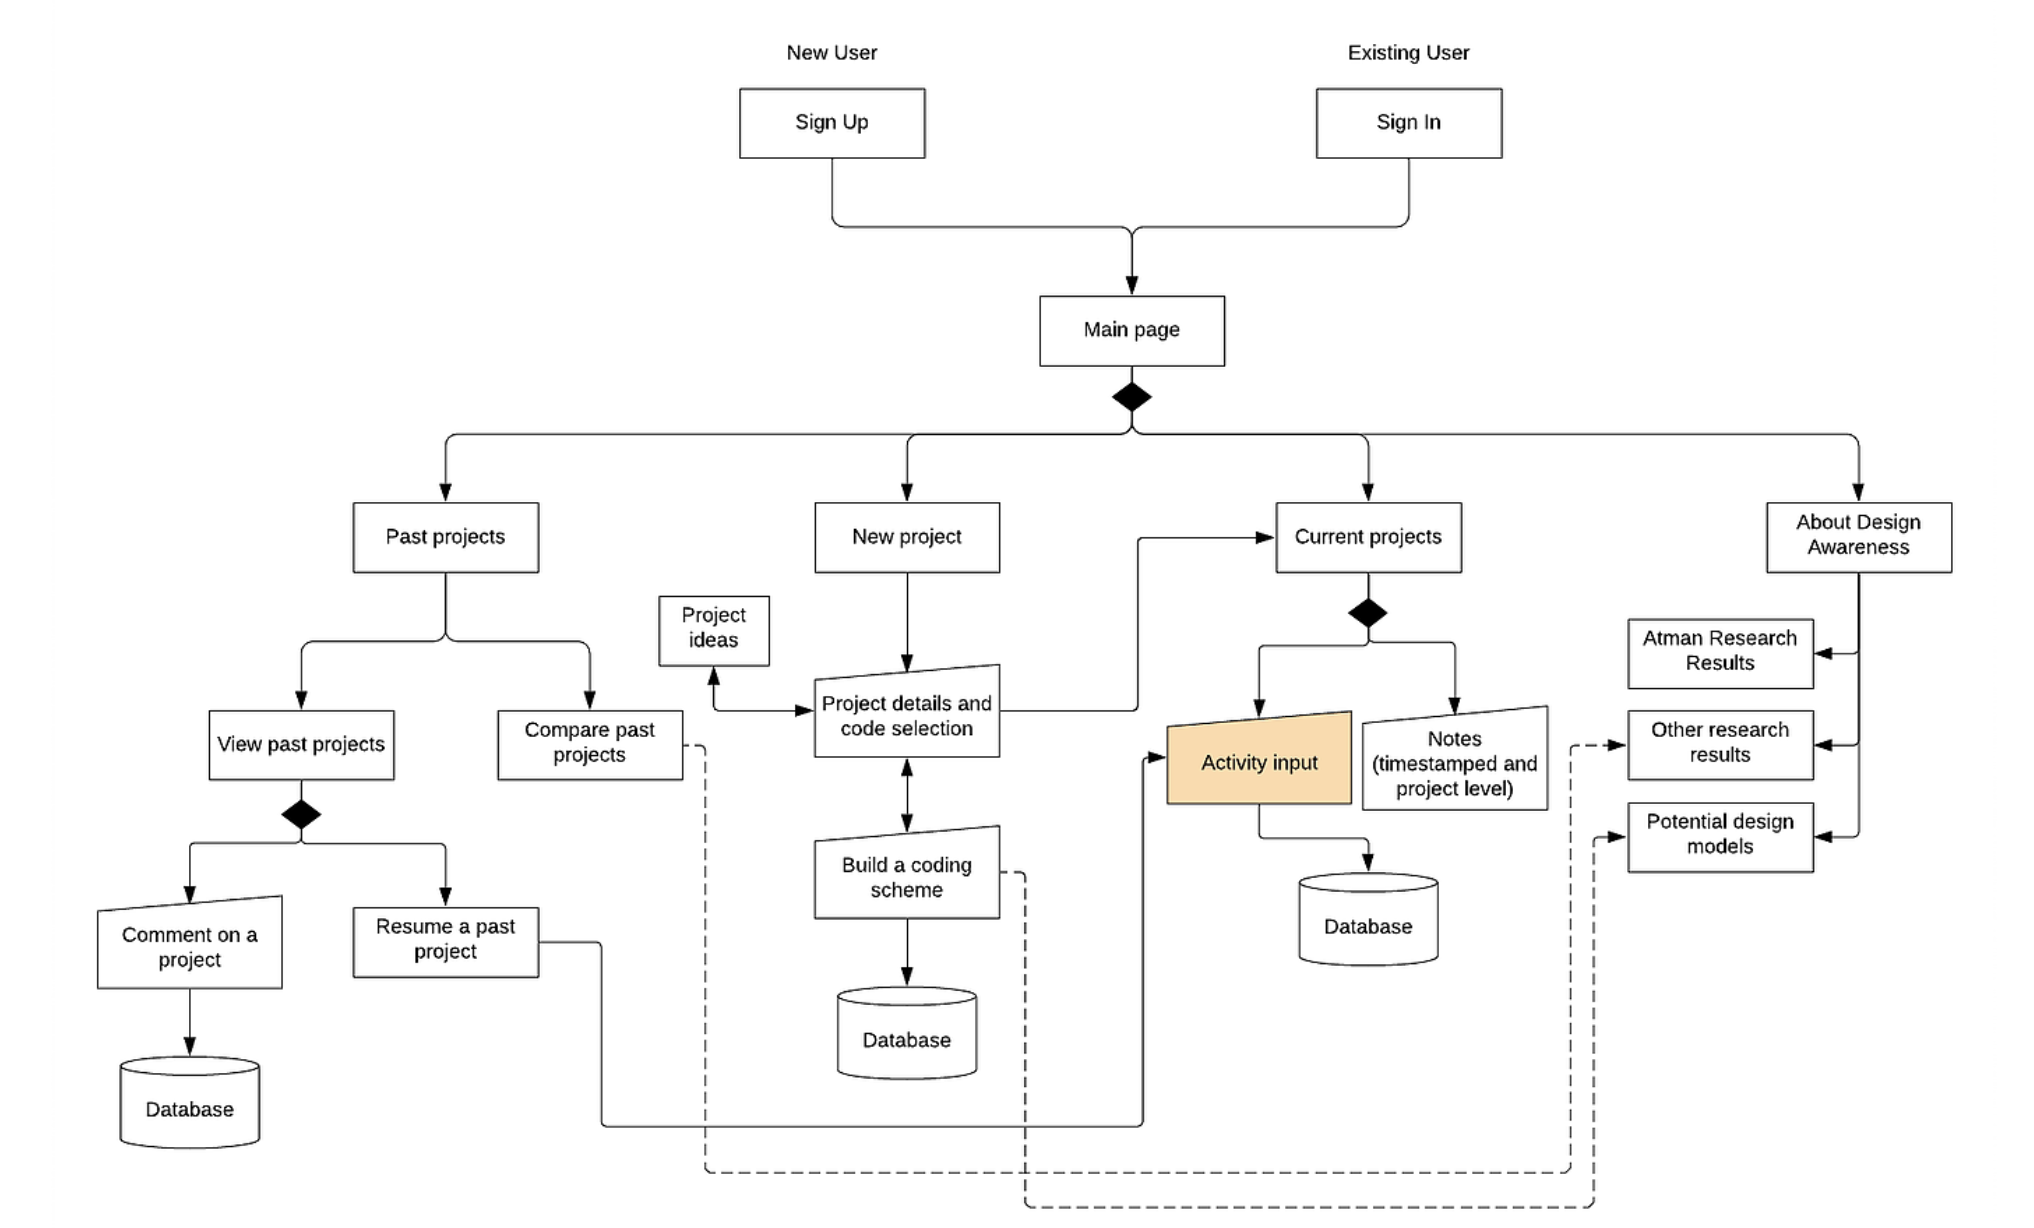
Information Architecture
Once we established our design requirements, we constructed an information archictecture diagram to out-line higher level elements of our interface.
04 Designing the Solution
Rapid Prototyping & Quick Evaluation
Based on our information architecture, we used Figma to rapidly prototype the design of our application. We then performed usability tests with multiple user groups to check for potential usability issues.
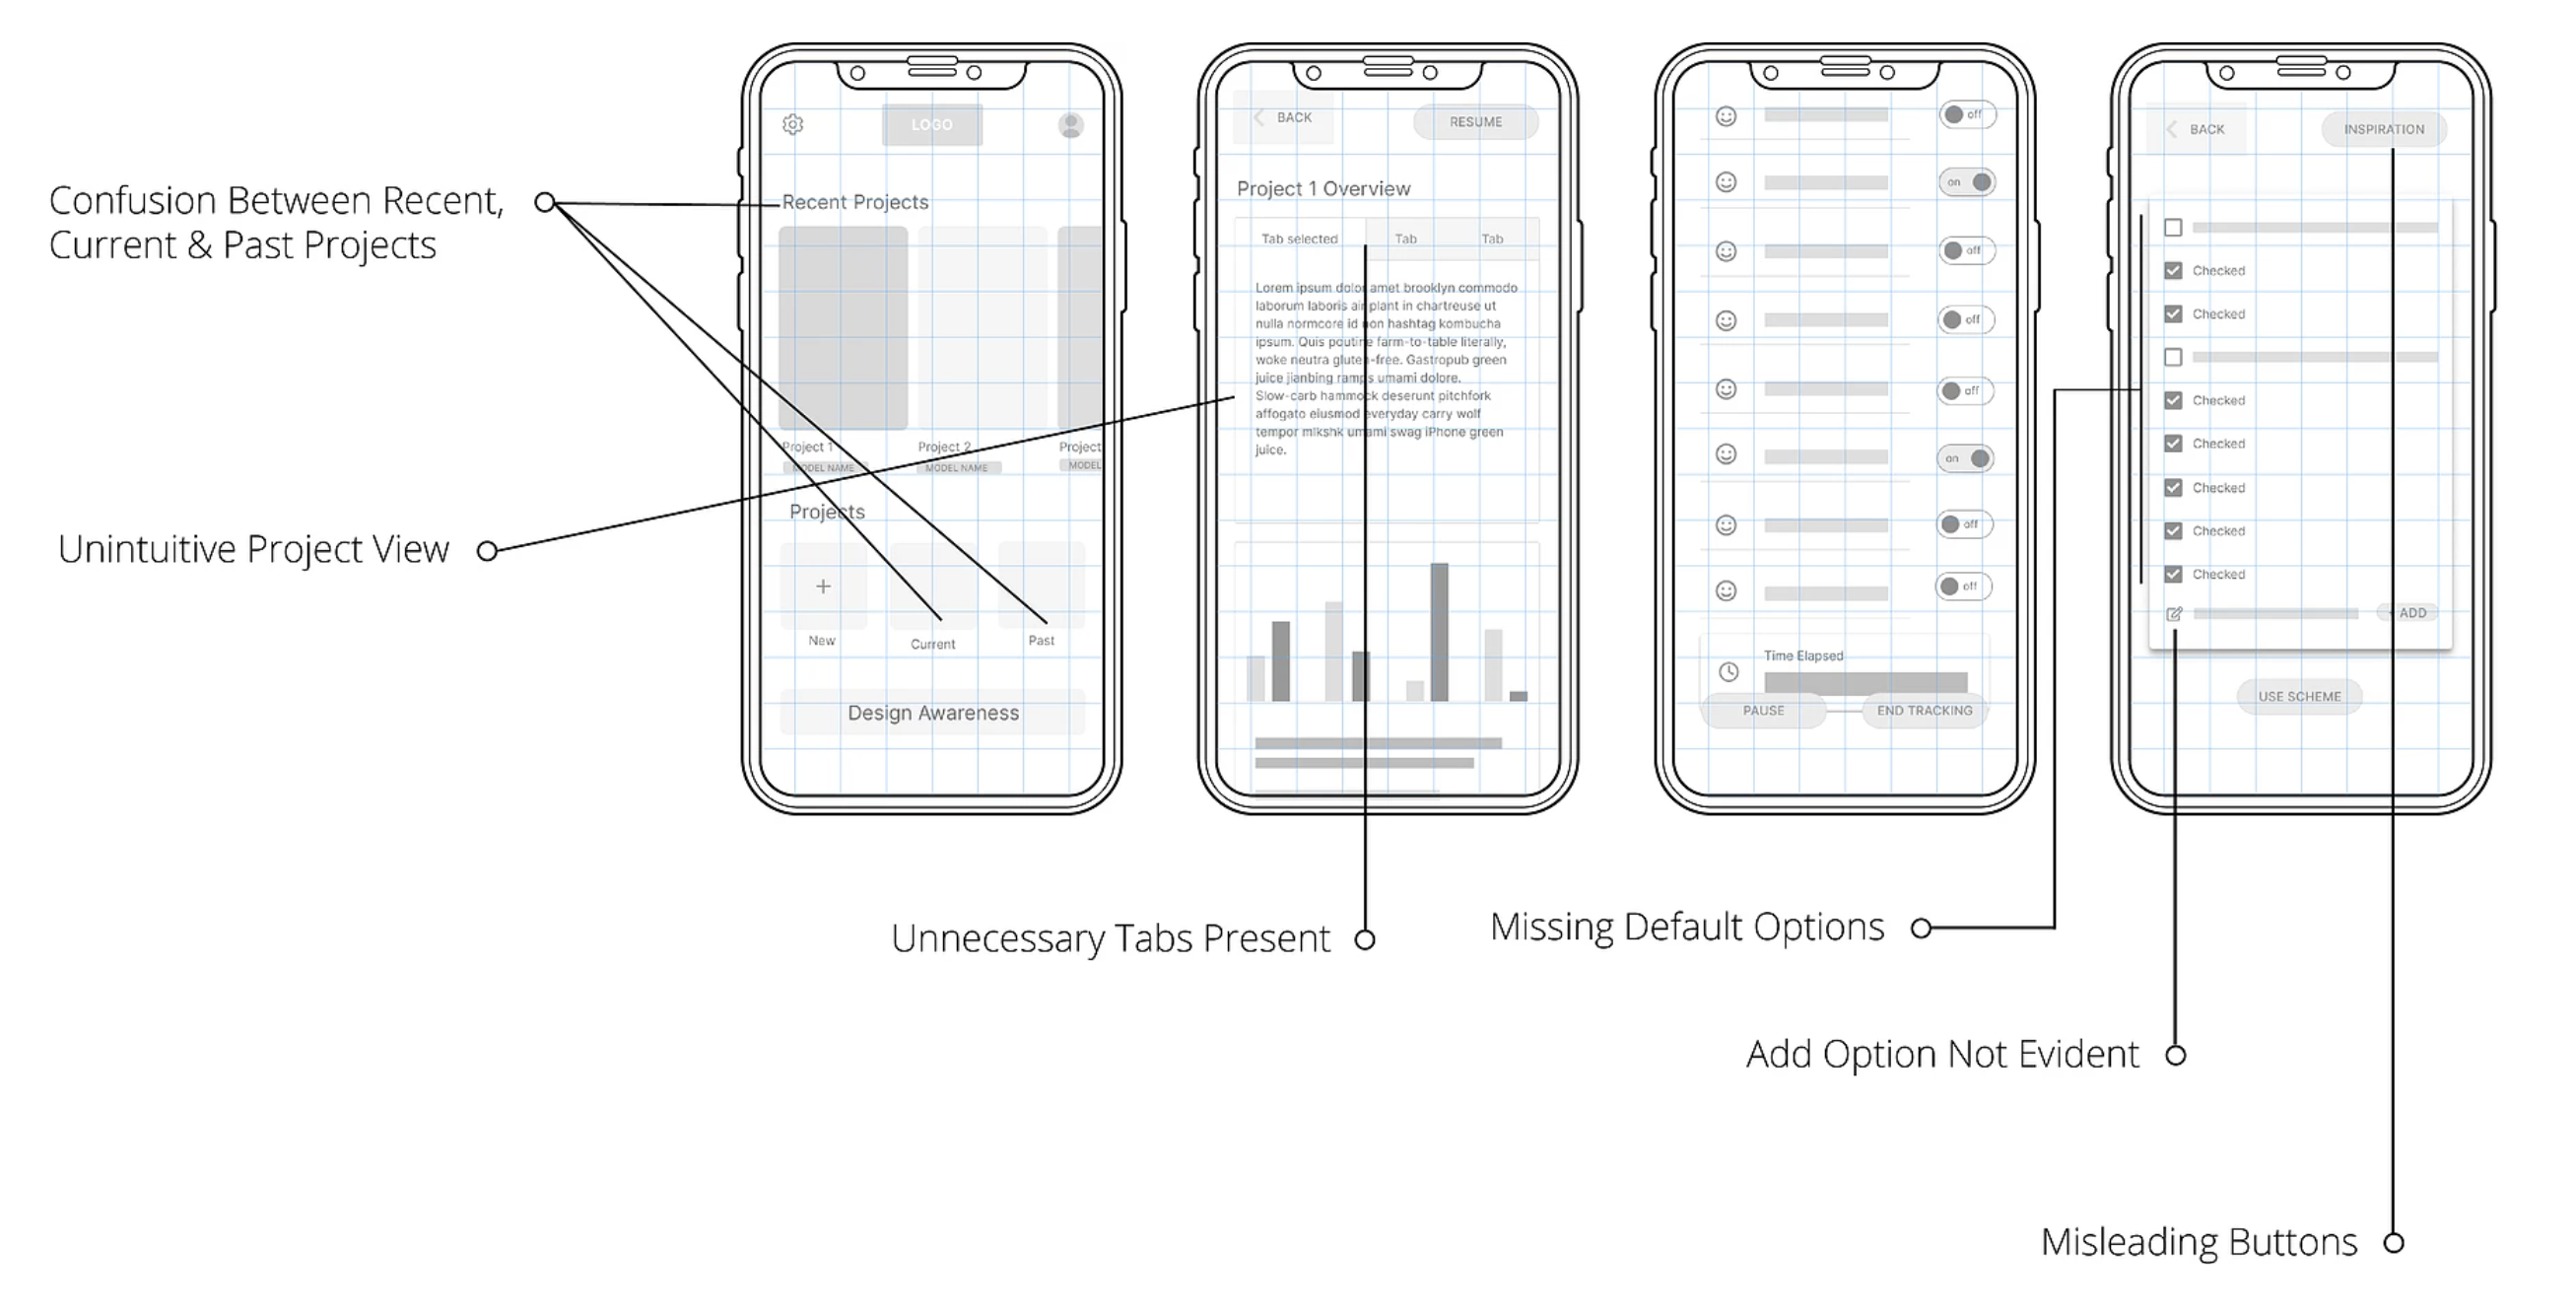 Primary User FeedbackUsers get confused about how they were supposed to access projects. There were too many options like recent, current and past projects presents
The project view tried displaying too much information in too little space, this made it confusing for users to get actionable information.
Lack of instructions and confirmation states made users find the 'building an activity scheme" option frustrating.
Options for users to compare their design-processes with those of higher qualities or to learn more about design awareness aren't accessible.
Since there is no navigation bar, users have to click on the back button multiple times to reach home.
Priorities for Version 2 Simplify the home page, remove redundant options, add information about design awareness.
Redesign the project view to reduce the cognitive load on users.
Add instructions and confirmation states to the 'build coding scheme' option.
Add appropriate navigation to allow users to switch between tasks easily
05 Refining the Solution
Version 2 Changes
Home Redesign

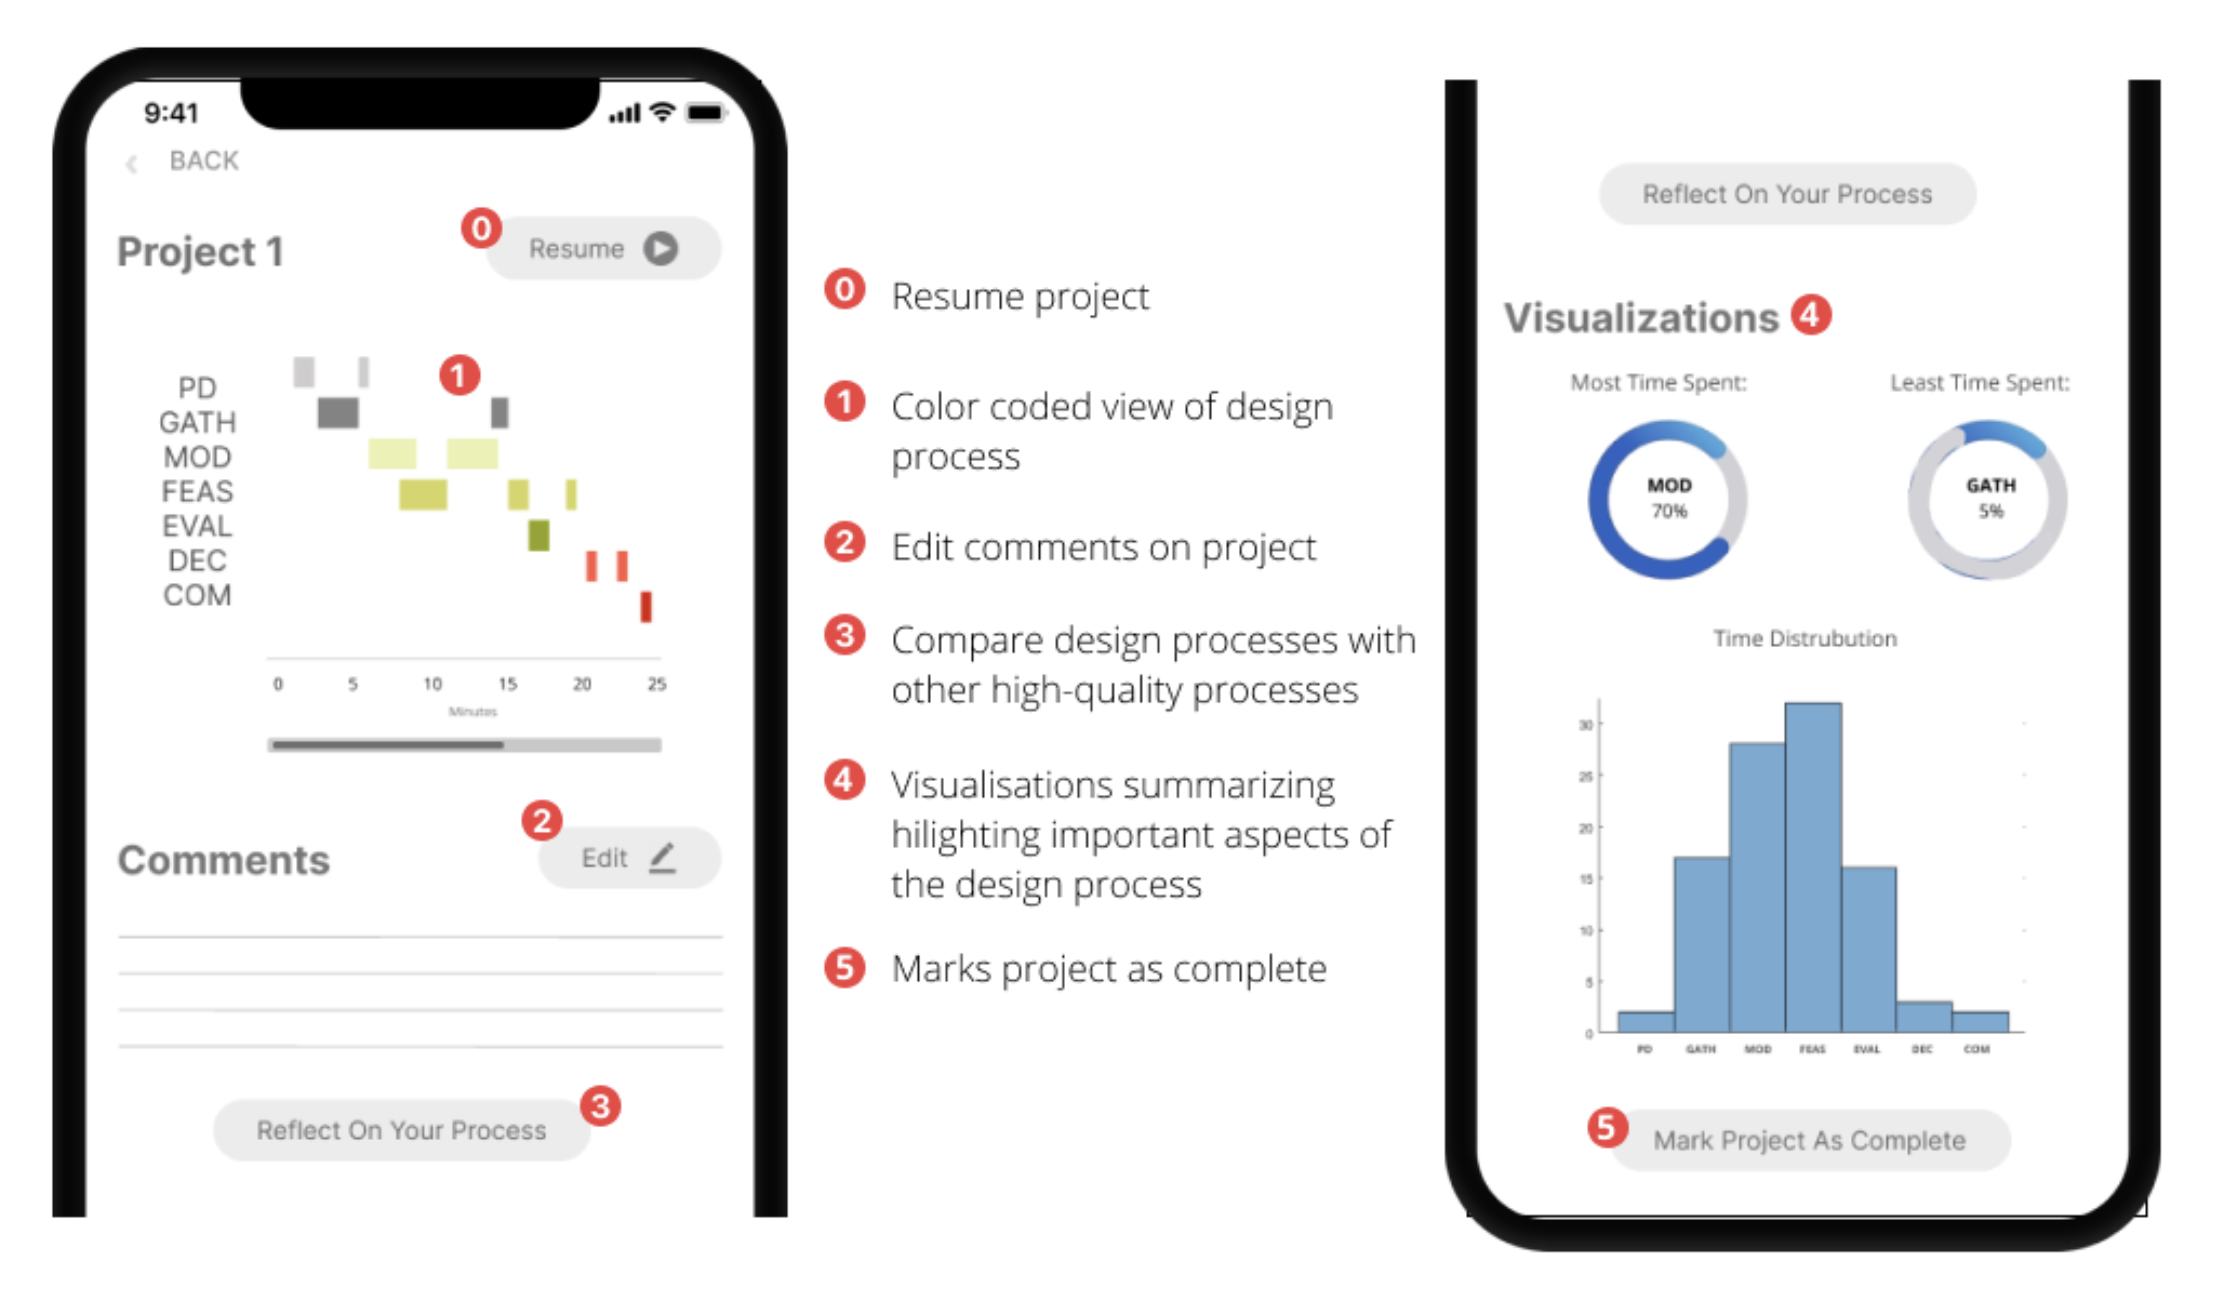
Project View Redesign
Adding Instructions and Confirmation States

Navigation OptionsThe issue with traditional navigation options was that our architecture didn't have enough menu pages to assign to each of the navigation menu's options.
The solution was to implement a simple '2 Click Rule', in which users will be able to go home from any given page in 2 clicks or less

Version 2 User Testing Feedback Users found the timeline too small to thoroughly interpret it
The names 'Coding Scheme' and 'Activity Code' confused the users
Users often forgot what each of the activity codes meant while they were tracking their process
Users wanted to take notes about their design process while tracking
Users were confused about why they could export and delete multiple projects
The wording of the button 'Reflect on your design process' confused users
Users were confused about the difference between reflecting on their process and comparing their process
06 Iterating the Solution
Version 3 Wireframes Opening a past project and adding a note to it
Usability Study
We created this survey to ask users to complete a number of tasks using our prototype and reflect on how each task went. There will be 3 main tasks, with smaller tasks included in each. The usability study survey was created using Google Forms.
Find the Survey Here